Click the Reports tab on the Navigation Menu.
Select the View Reports tab followed by the Utilisation tab.
To view the Activity
Chart, click on the link.
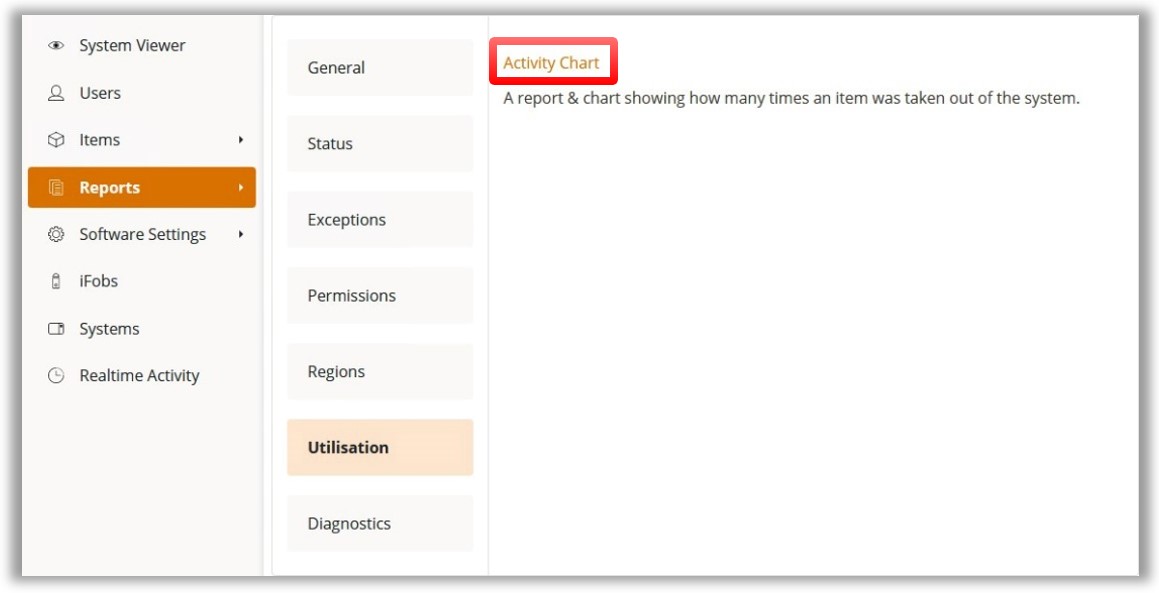
This report/chart shows how many times an item has been removed from the system.
Click the Reports tab on the Navigation Menu.
Select the View Reports tab followed by the Utilisation tab.
To view the Activity
Chart, click on the link.
You will be presented with the event report page. From here, you can select the time frame you wish the report to gather information from. Selecting the start or end date will allow you to input the specific days and times for the report. See Reports Overview for further details.
After selecting the date and time, the Refresh Report button will update the report.
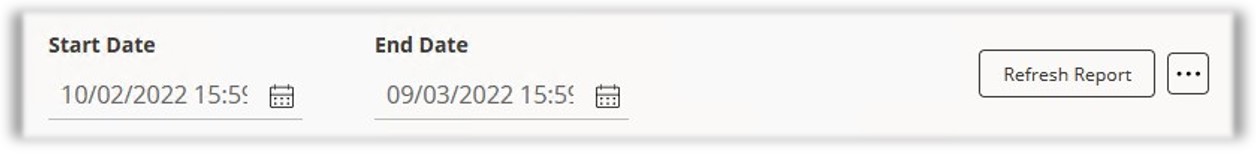
You can export the report as a PDF or into an Excel Spreadsheet by selecting the Ellipsis button from the toolbar.